

You share a blog post on Facebook. People react, a few leave comments, and the platform reports some clicks. But how many visits reached your website? And which version of your post brought people who stayed?
Those questions matter when your social media work is meant to support a blog. Reactions tell you something about activity on the platform. Website analytics helps you understand what happens after people follow a link.
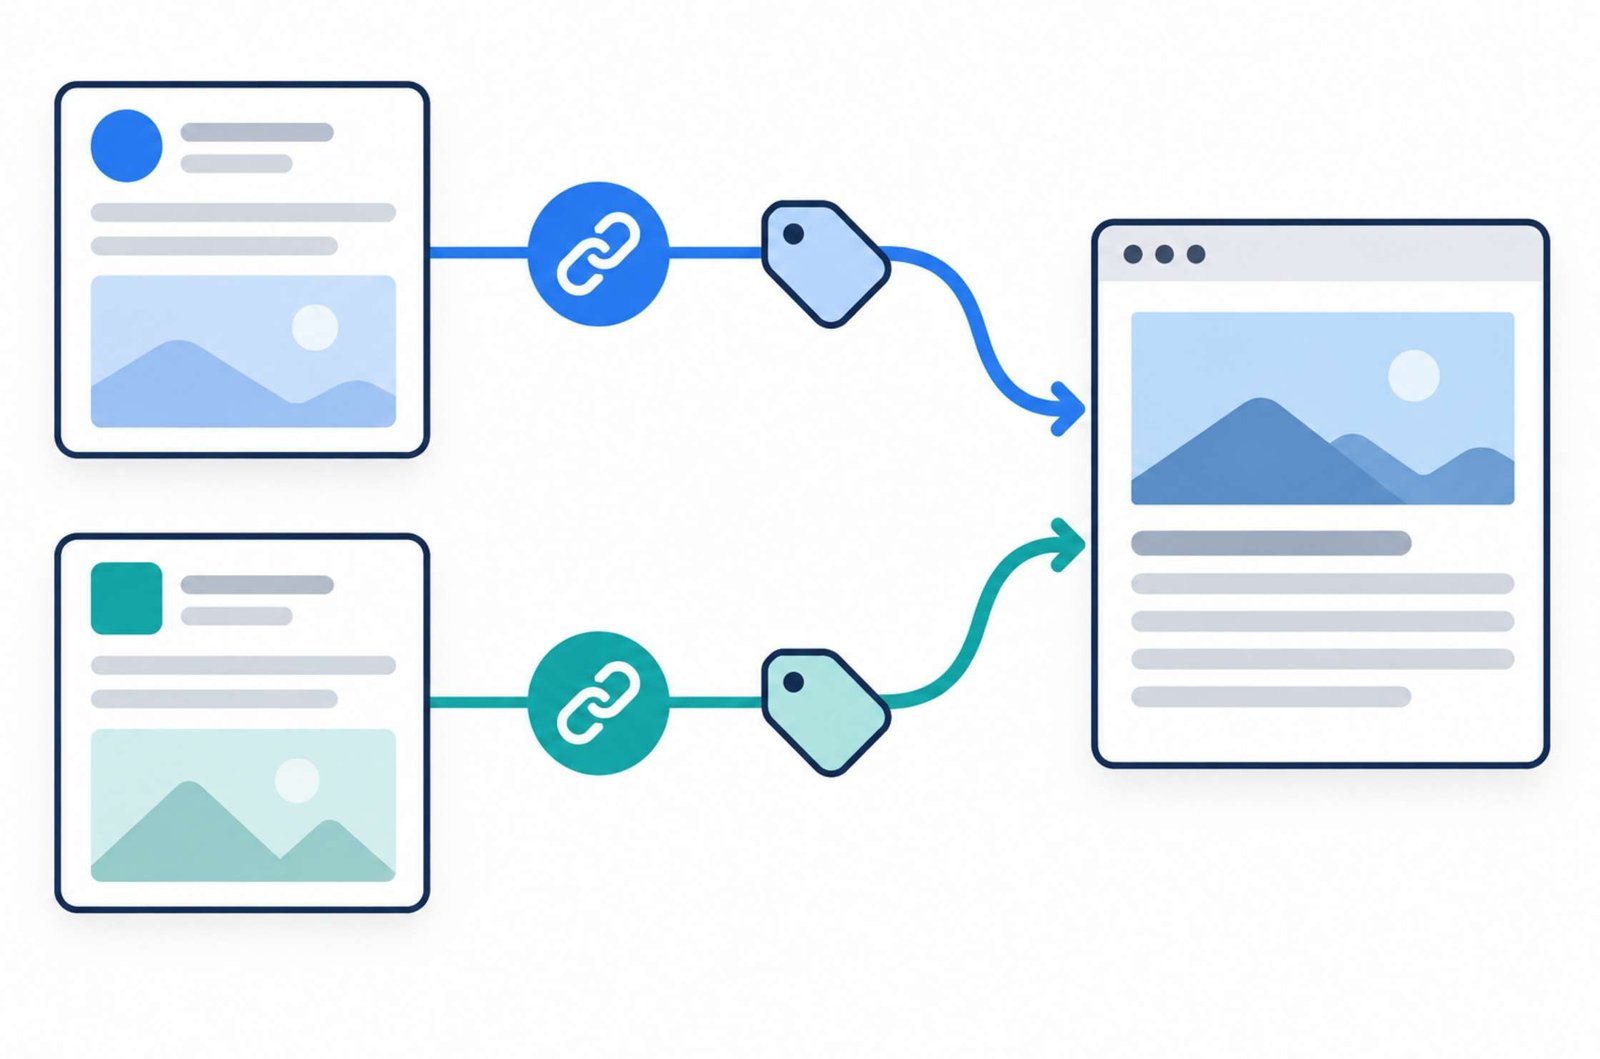
This guide walks through a small, repeatable tracking setup: one article, two social posts, and a separate tagged link for each. You will learn how to build those links, find their traffic in Google Analytics 4, and compare results without treating every click as a new reader.
The examples use unpaid Facebook posts, but you can adapt the naming system to other social platforms where you share clickable links.
1. Decide What You Want to Learn
Start with a question specific enough to influence your next publishing decision.
For example:
Does a post describing a reader’s problem bring more engaged visits than a post offering a practical checklist?
That is more useful than asking whether “social media works.”
For this walkthrough, imagine that you have published a tutorial about optimizing WordPress images. You want to promote it twice:
- Post A: Introduces the problem of images becoming blurry after compression.
- Post B: Highlights the tutorial’s checklist for preparing images before uploading.
Both posts lead to the same article. Each gets its own tracking label.
Keeping the destination the same makes the comparison easier to interpret. If you change the article, platform, image, caption, and audience at once, you will struggle to identify what deserves further testing.
Even with the same destination, ordinary social posts are not a controlled experiment. Publication time, distribution, and audience differences can influence the outcome. Use the results to choose your next test, rather than claiming that one caption caused a particular improvement.
2. Confirm That GA4 Is Collecting Website Data
UTM parameters are labels added to a link. They do not install analytics on your website.
Before creating a batch of links, confirm that your site has a working GA4 setup connected to the correct property.
Open an article on your website, then check GA4’s Realtime report for activity associated with that page. A private browser window can help separate the test from an existing browsing session, although consent settings and tracking protection can still affect collection.
Google recommends Realtime as a way to confirm that data is reaching Analytics. Other reports take longer to populate. See Google’s instructions for checking whether data is being collected.
If ordinary page visits are not appearing, resolve that problem first. Changing campaign names will not repair a missing or incorrectly configured analytics tag.
3. Give Your Social Links Four Clear Labels
For this simple setup, use four UTM parameters:
| Parameter | What it identifies | Example |
|---|---|---|
utm_source |
The platform where you place the link | facebook |
utm_medium |
The type of traffic | social |
utm_campaign |
The promotion these posts belong to | image_optimization_guide |
utm_content |
The individual post or variation | fb01_problem |
Google documents these parameters in its guide to campaign URLs.
Think of the campaign as the folder containing your related posts. The content label identifies an item inside that folder.
For the second post, keep the source, medium, and campaign unchanged. Change only the content value to fb02_checklist.
Use lowercase names and consistent spelling. Google treats differently capitalized parameter values as different values, which can split a campaign across multiple rows.
For unpaid social posts, social is a useful medium value because it matches Google’s Organic Social channel rules. Keep paid promotions separately labeled; this example is designed for organic posts. Google publishes its default channel definitions.
4. Build a Separate Link for Each Post
Here is the example destination:
https://example.com/optimize-images-wordpress/
The link for Post A becomes:
https://example.com/optimize-images-wordpress/?utm_source=facebook&utm_medium=social&utm_campaign=image_optimization_guide&utm_content=fb01_problem
The link for Post B becomes:
https://example.com/optimize-images-wordpress/?utm_source=facebook&utm_medium=social&utm_campaign=image_optimization_guide&utm_content=fb02_checklist
These are demonstration URLs. Replace the example domain and page path with your published article’s real address.
You can create the links with Google’s Campaign URL Builder. Enter the destination URL and your chosen parameter values, then copy the generated link.
Check the copied result before publishing. A correct campaign name attached to the wrong article is still a broken measurement setup.
Keep parameter values descriptive but impersonal. A label such as fb02_checklist is enough. Do not put a reader’s name, email address, or other personal information into tracking links. Google specifically warns against sending personally identifiable information through URLs and campaign parameters. See its guidance on avoiding PII collection.
5. Make the Post Match the Destination
Tracking is more useful when each post makes a clear promise that the linked article fulfills.
Here are two example captions for the image optimization tutorial.
Post A — problem-focused
Your blog images look sharp before uploading, but blurry after compression? This guide explains how to choose image dimensions, compare quality, and check the result inside WordPress.
Use the link ending with utm_content=fb01_problem.
Post B — checklist-focused
Before uploading your next blog image, check its dimensions, file size, and readability on mobile. Here is a practical WordPress image checklist you can follow from export to publication.
Use the link ending with utm_content=fb02_checklist.
These captions give readers a reason to visit while describing what they will find.
Avoid promoting a basic tutorial as a secret shortcut or promising a result the article cannot deliver. Otherwise, you may attract people whose expectations do not match the page.
Also keep a small publishing log. Record the publication date, platform, caption angle, exact tagged URL, and whether the post was organic or paid. This gives you the context needed to interpret the analytics later.
6. Test the Complete Journey
Before relying on a tracking link, follow it through the same route a reader will use.
Check that:
- The link opens the intended article.
- The page works on a phone.
- Any redirect or link-shortening service sends visitors to the correct destination.
- The tracking parameters reach the website without being removed before Analytics can collect them.
A URL that looks correct in your notes may behave differently after passing through a publishing tool or redirect.
Use Realtime to check that website activity is being collected. Then verify the campaign information in processed reports. A successful page load alone does not confirm correct attribution.
Do not expect every report to update immediately. Google states that processing can take 24–48 hours and that report data may change during that period. Its data freshness documentation explains these delays.
Avoid repeatedly clicking your own links to produce a larger test count. You only need enough testing to confirm the journey works.
7. Find the Campaign in Traffic Acquisition
In GA4, open Reports → Acquisition → Traffic acquisition.
Choose the date range covering your posts. Change the table’s main dimension to Session source / medium, then look for:
facebook / social
Use Session campaign as a secondary dimension, or apply a campaign filter, to isolate:
image_optimization_guide
This gives you a campaign-level view before you separate the individual posts.
Report navigation can vary between properties. If Traffic acquisition is missing, an Editor or Administrator may need to add it to the navigation. Google describes the report and its available dimensions in the Traffic acquisition documentation.
Use session-based dimensions for this exercise. First user source answers a different question: how someone was originally acquired. A returning reader can discover your site through one channel and later visit through another. Google explains this distinction in its comparison of User acquisition and Traffic acquisition.
8. Separate the Results for Individual Posts
To compare fb01_problem with fb02_checklist, create a Free-form exploration.
The dimension to use is Session manual ad content. Despite the word “ad,” it is the session-level dimension associated with your utm_content value, including the labels in this organic-post example. Google lists this mapping in its traffic-source dimension reference.
Set up the exploration:
- Open Explore and choose Free form.
- Set a date range that includes your published posts.
- In Variables, add these dimensions: Session source / medium, Session campaign, and Session manual ad content.
- Add these metrics: Sessions, Engaged sessions, and Engagement rate.
- Import the selected dimensions and metrics.
Google explains this workspace in its getting started guide for Explorations.
Next, configure the table:
- Put Session manual ad content under Rows.
- Put the three metrics under Values.
- Add a filter where Session source / medium exactly matches
facebook / social. - Add another filter where Session campaign exactly matches
image_optimization_guide.
Both filters must match for data to appear. These table controls and filter behavior are documented in Google’s Free-form exploration guide.
You should now be able to compare the two content labels once matching data has been collected and processed.
If the table is empty, first check the date range and the exact spelling of your filter values. Then check the original published links.
9. Understand the Three Numbers You Are Comparing
Sessions describe periods of interaction with your website. They are not a count of unique people: one person can return and create multiple sessions. Google explains session measurement in its Analytics sessions documentation.
Engaged sessions meet GA4’s engagement criteria. Under the default timing setting, a session qualifies if it lasts longer than 10 seconds, includes a key event, or contains at least two page or screen views.
Engagement rate is engaged sessions divided by total sessions, expressed as a percentage. These definitions come from Google’s engagement rate documentation.
An engaged session does not prove that someone read the entire article, understood it, or found every section useful. Treat it as one indicator of behavior after arrival.
For a blog, start by examining both the number of engaged sessions and the percentage. A percentage alone can look impressive when it represents only a handful of visits.
10. Compare Results Without Inventing a Winner
Consider this hypothetical example. These numbers are for illustration; they are not results from a real campaign.
| Post | Sessions | Engaged sessions | Engagement rate |
|---|---|---|---|
| A: Problem-focused | 240 | 60 | 25% |
| B: Checklist-focused | 120 | 72 | 60% |
Post A produced more recorded sessions. Post B produced more engaged sessions, despite bringing fewer visits overall.
If your immediate goal is to attract visitors who spend some time with the site, Post B is worth testing again.
However, this table does not establish why the difference happened. Perhaps the checklist set clearer expectations. Perhaps its audience was more relevant. Perhaps one post received distribution in a different community.
Write a modest conclusion:
The checklist post produced more engaged sessions in this comparison. Repeat that approach with another relevant tutorial and check whether the pattern continues.
Avoid turning one comparison into a universal rule about what a platform’s algorithm prefers.
Give each post a comparable observation period. For example, you might review the first seven complete days after each publication. Seven days is a practical review window for this exercise, not a platform requirement or a guarantee that enough data has accumulated.
If the results are based on very few visits, record them and keep collecting evidence.
11. Expect Social Clicks and GA4 Sessions to Differ
A click recorded by a social platform and a session recorded on your website measure different points in the journey.
Someone can click twice during one visit. Someone else can click and close the page before Analytics loads. Tracking protection, consent settings, or an implementation problem can also affect what your website records.
Google discusses several of these mechanisms in its click-versus-session troubleshooting guide. That guide addresses Google Ads specifically, but the basic distinction between a click and a website session also matters when interpreting social traffic.
Check which click metric the social platform is showing. A broad interaction count is not necessarily a count of visits to your destination.
There is another limitation: a tagged URL can be copied. If someone shares your Facebook-tagged link in a private message elsewhere, the labels can travel with it. UTM values identify the link’s assigned campaign; they do not independently verify the place where every later click occurred.
Investigate large or sudden discrepancies, but do not expect the two systems to match perfectly.
12. Use the Results to Plan the Next Post
A useful review should end with one concrete action.
If one post brings visits but relatively little engagement, read its caption beside the article’s opening. Do they describe the same problem? Does the page deliver the promised checklist or explanation promptly?
If both posts bring almost no sessions, inspect the basics before rewriting the article. Check the links, confirm collection, and review whether the posts actually received exposure.
If one approach performs better repeatedly, develop another post using that approach while keeping the promise specific to its destination.
Keep internal website links separate from this campaign system. A “related article” link serves navigation within your site; it should not carry a Facebook promotion label.
For your first tracking exercise, keep the scope small: one useful article, two clearly labeled social posts, and one saved GA4 exploration. Review the results after processing, note the limits of the comparison, and choose a single improvement for your next publication.